(Note from Marc Kuchner: This software has been a great boon to us here at Backyard Worlds: Planet 9. Thank you to Frank for writing it!)
AstroToolBox is a Java toolkit for the identification and classification of astronomical objects with a focus on low-mass stars and ultra-cool dwarfs. It contains a catalog search for SIMBAD (measurements & references), AllWISE, CatWISE, 2MASS, Gaia, Pan-STARRS, SDSS, among others, plus a spectral type evaluation feature for main sequence stars including brown dwarfs. The toolkit has an image viewer that blinks WISE images from different epochs, in order to visually identify the motion or variability of objects. These images can be saved as PNG or animated GIF files. Overlays of all featured catalogs can be added as needed. Custom overlays can be created from any TAP enabled VizieR catalogs or local files.
AstroToolBox displays time series (static or animated) using infrared and optical images of various surveys (DSS, SDSS, 2MASS, AllWISE, DECaLS, …). It contains a photometric classifier that uses the photometry of the above-mentioned catalogs to create a detailed spectral type classification. In addition, the toolkit has a file browser linked to the image viewer, which makes it possible to check a large list of objects in a convenient way.
Interesting finds can be saved in an object collection for later use. The tool also offers a number of handy astrometric calculators and converters. The toolkit offers additional advanced features such as an ADQL query interface (for IRSA, VizieR and NOIRLab databases) and a batch catalog search that takes a CSV file with object coordinates as input.
What you’ll probably use the most is the image viewer with the catalog overlays. So, I recommend to start getting familiar with this first. The catalog overlays (colored circles displayed on the WISE images) can be clicked to show relevant catalog information including spectral type estimates.
The latest version of the toolkit can be downloaded from the AstroToolBox Github page by clicking the “Download latest version” link.
You need to have a Java Runtime Environment installed on your computer, which normally should be the case. If you don’t have a Java Runtime Environment installed yet, go to the Java download site and download the latest version. Double-click the downloaded file to start the installation process. After successful installation, you can start the toolkit by double-clicking on the AstroToolBox-x.y.z.jar file (where x.y.z stands for the current version number).
If you have any questions regarding the toolkit or need advice on how to use it, don’t hesitate to post your questions to the AstroToolBox Google group. You need to sign in with your Google account credentials. Have fun with your AstroToolBox, aka the Brown Dwarf Hunter’s Leatherman!
This week, I’m excited to present this guest post from two of our users, Dan Caselden and Paul Westin. They wrote their own tool for viewing the WISE data, called “WiseView”. It provides some useful options you won’t find at the backyardworlds.org site. Enjoy!
Marc Kuchner
As you may know, the images at ByW: P9 all ultimately come from a database called unWISE, which is a project that reprocesses WISE single exposures to generate coadded images with improved clarity. Since we citizen scientists with ByW: P9 are always eager to know more about our subjects, we found ourselves often visiting the unWISE site to obtain different views of our favorite patches of sky.
However, we felt that unWISE’s packaging could stand to be a little more user friendly. So, after a while, we decided to add a friendly wrapper, to make this data easier to examine, and share it with you. We’re a far cry from User Interface/User Experience professionals, but, hey, it’s a start!
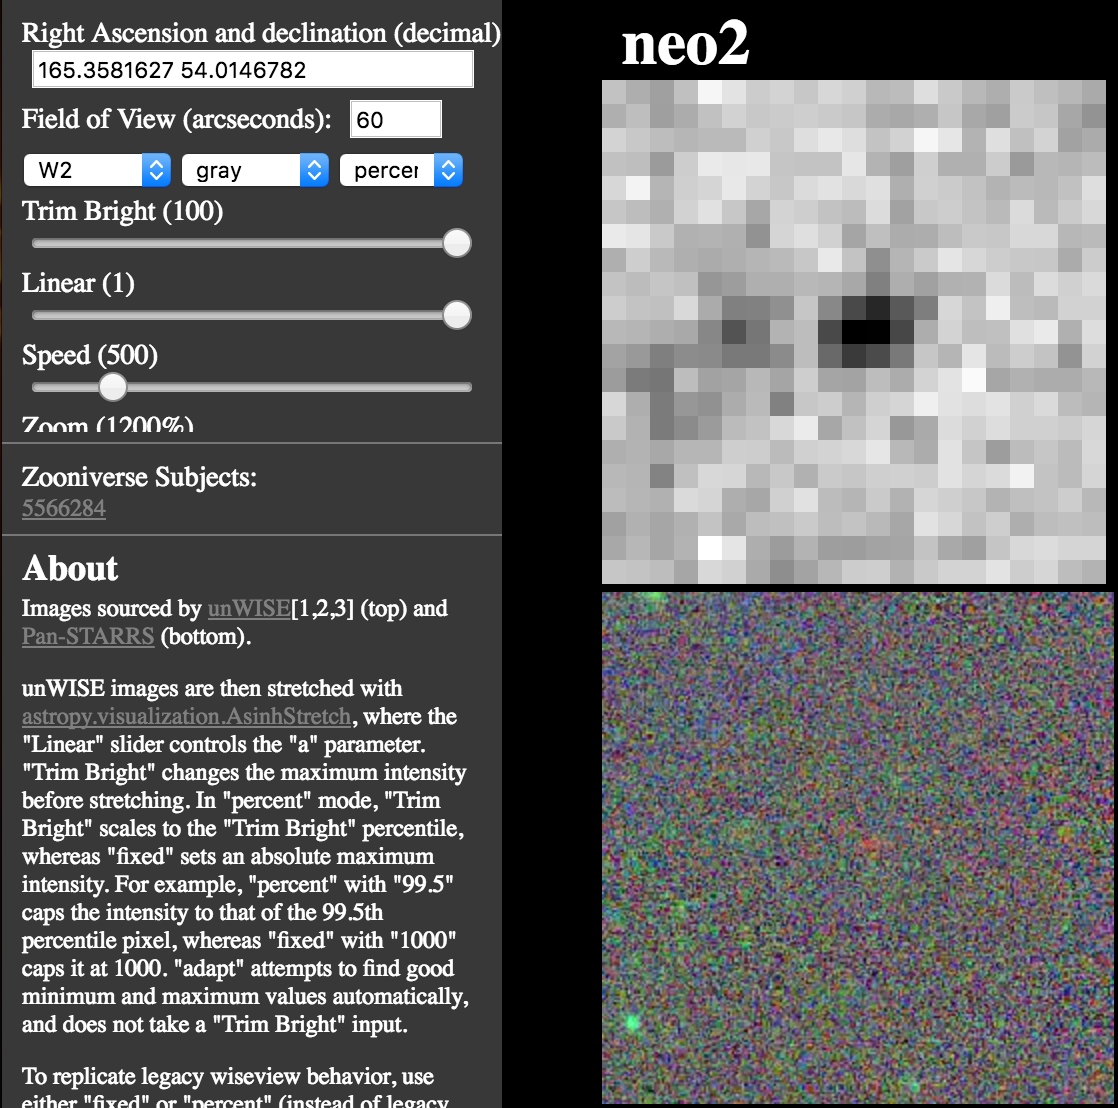
Our tool, wiseview (http://byw.tools/wiseview), displays two sets of cutouts (i.e., portions of larger images of the sky). At the top, wiseview flashes coadded imagery from the WISE satellite. These cutouts come from unWISE. unWISE currently contains coadded images for three data sets: AllWISE, NeoWISE-R1, and NeoWISE-R2. unWISE coadds are full-depth. That is, unWISE NEO1 also incorporates the single exposures used by unWISE AllWISE, and unWISE NEO2 also incorporates the single exposures used by unWISE NEO1 and unWISE AllWISE. Consequently, particularly high proper motion options will appear to stretch, or even fade in one position and appear in another.
Since ByW: P9 participants are on the hunt for things that move in WISE data, unWISE images are a natural resource for further investigation. After identifying coordinates of a pattern possibly indicative of proper motion, participants can zoom in with wiseview to see a closer representation of the underlying data from the flipbooks. The “field of view” parameter selects what size cutouts to display, in arcseconds, and the zoom slider blows up the unWISE cutouts. WISE W1 and W2 bands can be isolated with the WISE band field (W1 for W1, W2 for W2, and W1+W2 for both), and the “Speed” slider changes how quickly the cutouts flash.
The second cutout is a composite image from PanSTARRS-1, created in the same way as the default PanSTARRS-1 cutouts: band y colors red, band i colors green, and band g colors blue. PanSTARRS-1 cutouts are great for comparison versus unWISE because many unwanted sources and some of the brighter and/or earlier brown dwarfs show distinguishably.
unWISE Post-Processing
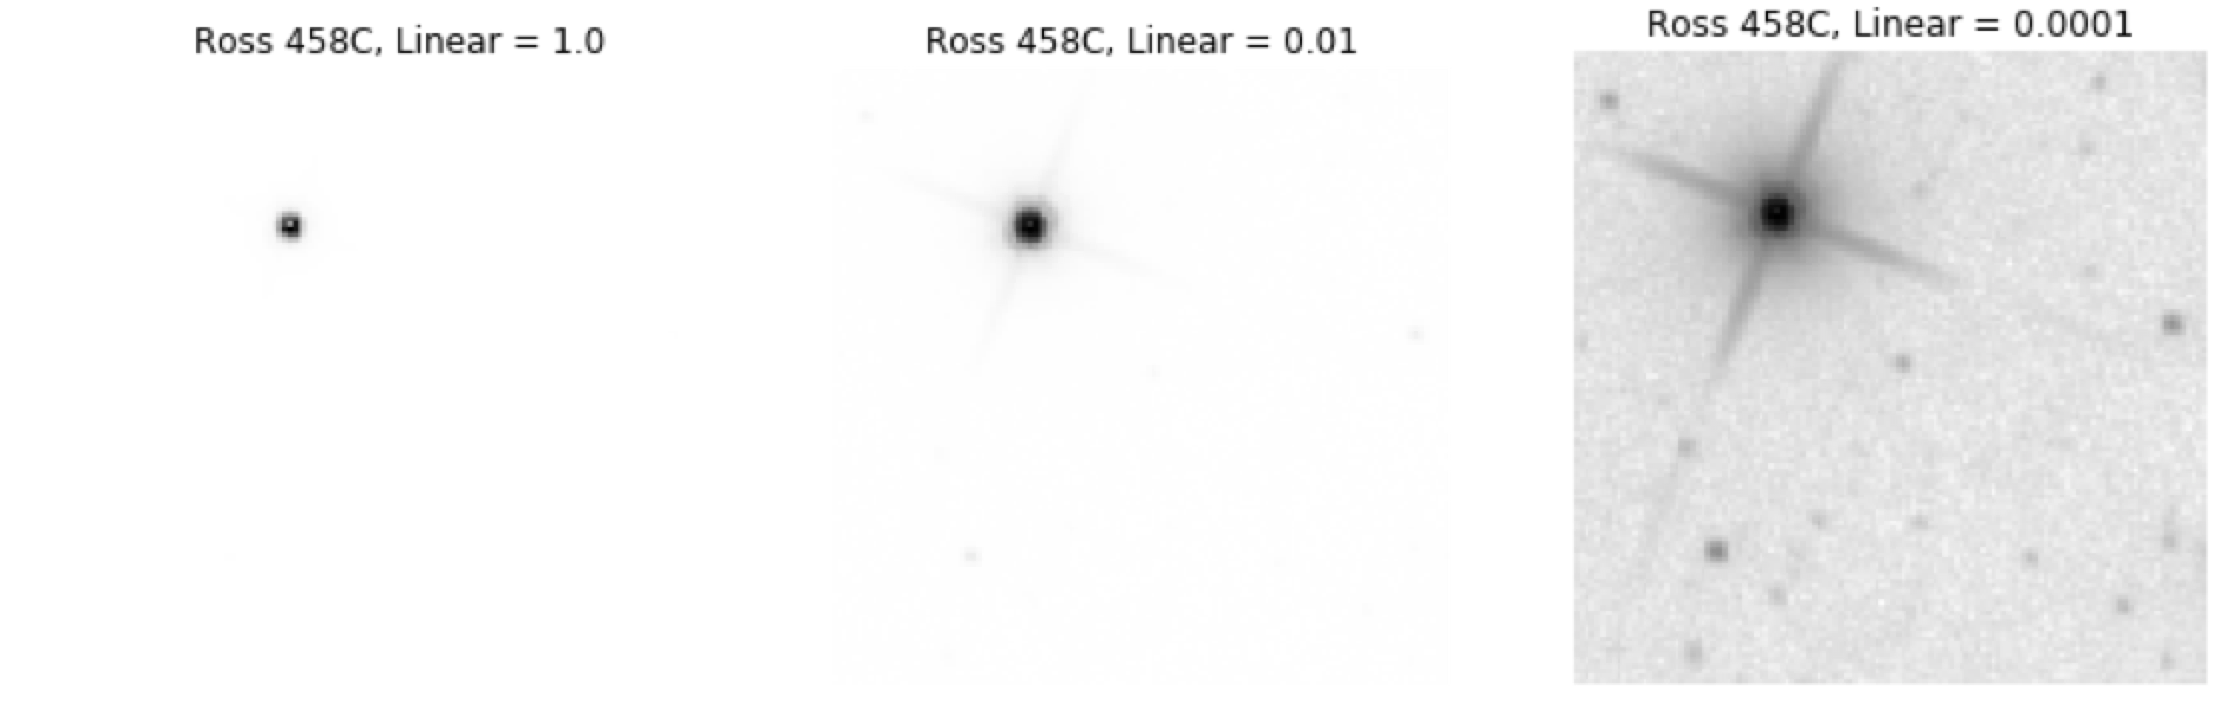
unWISE cutouts are normalized with astropy.visualization.AsinhStretch, and mapped to a colormap with matplotlib. The following images show AsinhStretch applied to a greyscale gradient with differing values of ‘a’. The ‘Linear’ parameter in wiseview is directly passed through to this parameter in AsinhStretch. ‘Linear=1.0’ applies a purely linear normalization to the image, which has no effect.
Lower values highlight lower intensity pixels, which is useful for observing faint sources, or those obscured by other, brighter, sources. For example, The images below show Ross 458C with varying values of ‘Linear’.
However, purely AsinhStretch normalization can make modest proper motions difficult to discern. Observationally, the normalization appears to lose dynamic range at the edges of sources, which is where the eye seems to most perceive motion in these images.
The three modes, ‘fixed’, ‘percent’, and ‘adapt’, attempt to compensate for this by capping intensity ranges before AsinhStretch normalization. ‘fixed’ caps the maximum intensity to an absolute number supplied by the slider ‘Trim Bright’. ‘percent’ caps the maximum intensity to a percentile within the image, again using the slider ‘Trim Bright’. ‘adapt’ is very much a work in progress that (poorly!) attempts to find a good intensity range automatically.
Why wiseview?
We wrote wiseview to improve our accuracy (and sate our curiosity!) when classifying candidates in the ByW: P9 flipbooks. With wiseview, curious participants can investigate their subjects to show whether their candidates demonstrate proper motion. For particularly challenging candidates that are not easily distinguishable in other available imagery like 2MASS, comparing unWISE coadds can be our only option to demonstrate proper motion.
Although we originally wrote wiseview for use with ByW: P9, its applications are more general; anyone searching near-infrared for objects in the solar neighborhood may find it helpful. In fact, multiple ByW: P9 participants discovered candidates in side projects using wiseview.
By the way, if you’re interested in unWISE, another great resource is legacysurvey.org’s Sky Viewer. For getting a quick big picture of what’s going on in a portion of the sky and disambiguating sources, their tool is invaluable. It also provides other image sets and catalog overlays, like DECaLS and SDSS, if your coordinates are lucky enough to fall within those surveys. Very nice!
Thank you!
We are Dan Caselden and Paul Westin, two computer security researchers from California with absolutely zero background in Astronomy. Thanks for reading!
So you’ve been playing with Backyard Worlds: Planet 9 for a day or two now, and finding some interesting critters. You read the F.A.Q. and learned how to read an object’s R.A. and declination using the numbers on the bottom and left edge of the images. You’ve even looked up some of your favorite objects in SIMBAD using those coordinates. And most of them are listed in SIMBAD, maybe as high proper motion stars. But some of them are #notinsimbad!!
If you’re starting to find objects that are not in SIMBAD, it’s time to take a peek a VizieR. VizieR is harder to use than SIMBAD, but it also has many many more sources in it. So if you find something that’s #notinvizier, well that’s a big deal. And even if the object you found is in VizieR, it’s entirely possible that nobody realized that it’s a moving object! That’s also a big deal.
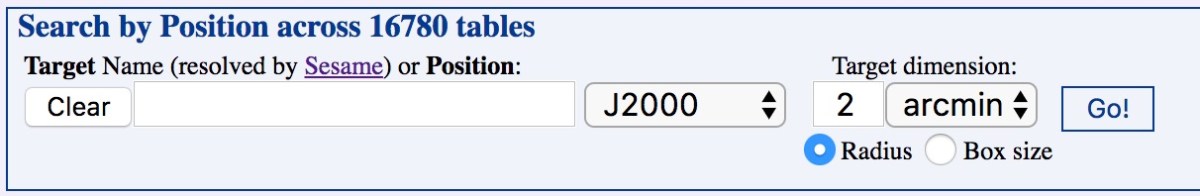
So how do you use VizieR? First, you’ll want to type in your object’s coordinates. but don’t type them into the search bar on the top of the page. Type them into the search bar that is labeled “Search by Position across 16780 tables” (the number of tables might be different when you get there).
Next click “Go”. (You can’t just hit return.)
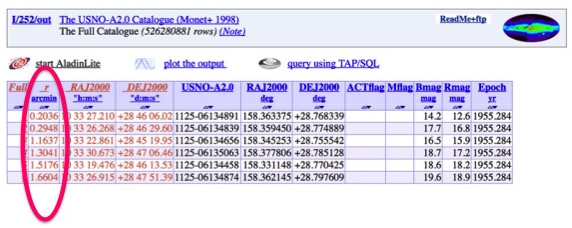
Now you should see a huge page full of tables like the one below. Each one contains the results from searching a different catalog. Every year, VizieR adds more tables to its repository, so every year the pages get longer and longer.
This one below lists sources from the USNO-A2.0 Catalog. USNO is the U.S. Naval Observatory. They have a long history of carefully and accurately measuring the positions of stars. Can you guess why the Naval Observatory got interested in positions of stars?
The “r” column in each table shows you how far each source is from the coordinates you entered. An arcminute is about 0.0167 degrees.
Anyway, turn your attention now to the column labeled “r” on the left of the table. Every table has one. This column shows the angular distance between the source in the table and the coordinates you entered. That’s important! The sources are listed in order by distance. So when you look through the tables, start by looking at the source in the first row; it’s the closest one to where you thought your source was located. Then work your way down. It’s easy to make a mistake of 1 arcminute (roughly 0.017 degrees) when you are are reading the coordinates of your favorite object off of the flipbook axes. But the tickmarks on the flipbooks are about 2.4 arcminutes apart; you probably didn’t get the coordinates wrong by that much.
Now, since Backyard Worlds: Planet 9 is all about finding moving objects, the next thing you might want to do is search the page for known moving objects! There are two phenomena that make objects in our project move across the sky: proper motion and parallax. Parallax is caused by the Earth’s orbital motion, which changes our point of view. Proper motion is caused by the object’s own motion through space. Proper motion is generally easier to measure; many more objects have measured proper motion than measured parallax.
Proper motions are measured in milliarcseconds per year (mas/yr). A milliarcsecond is 1/1296000000 of a circle, i.e. a very very small angle. A typical pizza in a New York pizzeria is about one milliarcsecond across…if you are looking at it while standing in California.
Now on to the business of deciding whether you have made a big discovery. Let’s search the VizieR page for measurements of proper motion. On my Mac, I can search within a webpage using the COMMAND F buttons on my keyboard. There is probably a similar keystroke on a PC. There are two directions of proper motion: proper motion in Right Ascension and proper motion in declination. The corresponding search terms to use are “pmra” and “pmdec”. Go ahead and pick one of those search terms and do a search, and see what you get.
If someone else has already found your dipole/mover there will be a source somewhere on the page with a proper motion–ra or dec–that’s greater than about 100 milliarcseconds per year (mas/yr).If you can’t find such an object in the whole page, then your object is #notinvizier.
On Backyard Worlds: Planet 9, objects that we see as movers tend to move at least 900 milliarcseconds per yer. Dipoles can range down to about 100 milliarcseconds per year if they are bright. So the idea here is to see if anyone else has previously published a dipole or mover near your search coordinates.
Here’s an example of a catalog on VizieR that lists proper motions. One of the measured proper motions is circled in red because it’s more than 100 milliarcseconds. That’s what you have to keep an eye out for. But note that this particular object, with pmRA=106.0 milliarcseconds per year, is r=1.6012 arcminutes away from the search coordinates. So that might be a different object after all…
Object 16 on this table has a proper motion > 100 milliarseconds per year, so it could be a dipole.
Now, there are many catalogs of stellar proper motions. You may find they contain contradictory information! I want to call your attention to one called “Gaia DR 1”. That’s a catalog containing the first data release from ESA’s GAIA mission. It just came out this summer. It is very deep and very accurate–probably the most reliable proper motion catalog. If you find that a particular source located, say, r=0.394 arcseconds from your search coordinates appears in multiple astrometric catalogs, the Gaia DR1 measurements are the ones I would trust. If you can’t find the object in Gaia DR1, a decent rule of thumb is to go with the catalog with the most recent publication date.
Note: do not trust the proper motions from the AllWISE Catalog! They are not really proper motions! They are mislabeled in VizieR.
After you finish examining the data on proper motion, the next thing to do is to search the page for “type” to lean what other researchers think the object’s spectral type is. You may find nothing, or you may find that different catalogs have differing opinions. This article by Alan MacRobert provides a good introduction to spectral types and stellar classification. If you do not see a spectral type listed, we may want to follow it up to get a spectral type, even if someone else previously recognized the object’s high proper motion. If you do not spot a spectral type on VizieR, flag the object with the #nospectraltype flag on TALK.
Conflicting measurements are one potential pitfall with using VizieR. There are more potential pitfalls. For example, while you are using VizieR, that just because a table comes up where the name of the table mentions “quasar” for example, that doesn’t mean your object is a quasar. It may be a table from a paper that is mostly about quasars–but this particular table is a list of the rejects, or the calibrators.
All this can get confusing, I know! VizieR is a powerful tool meant for professional astronomical research, and it is not very user-friendly. Don’t worry if it doesn’t make sense at first glance; congratulate yourself on making the effort to use it! Don’t be afraid to ignore this whole blog post and just focus on doing classifications or using SIMBAD. And don’t be afraid to ask us for help, e.g. on TALK.
And remember, if you find a mover or dipole that is not in VizieR, or which is in VizieR but has no spectral type, be sure to make a note of it in TALK using the #notinvizier or the #nospectraltype tags. And be sure to submit it using the Think You’ve Got One form.
Thanks to Lucero Lopez, Cara_na and Sehajroop Bath for requesting this article! Good luck to everyone!